Motivation
This project provides an interactive way to explore global earthquake data. Users can filter earthquakes by magnitude, depth, and time to analyze seismic activity patterns and trends.
Data Source
The application utilizes earthquake data from the USGS Earthquake Database, which includes information on location, magnitude, depth, and time of recorded earthquakes.
Visualization Components
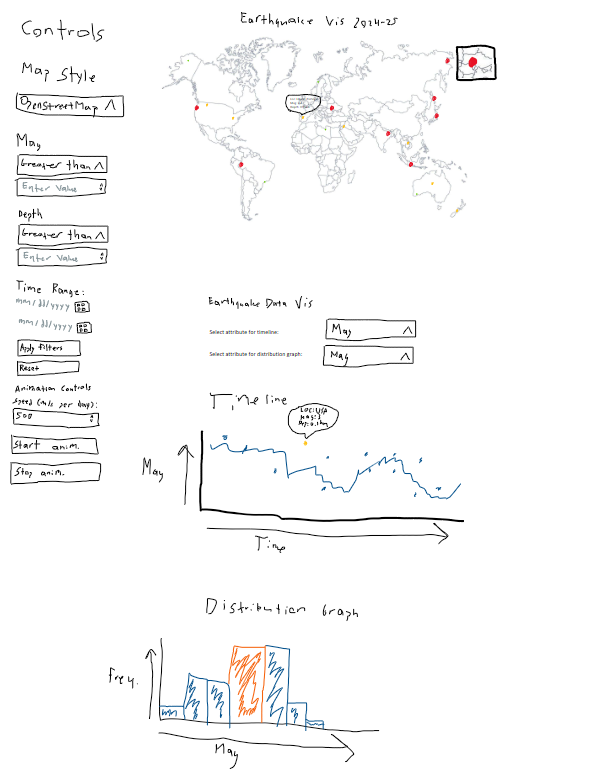
- Map View: Displays earthquakes as colored markers on an interactive map.
- Magnitude Chart: A bar chart showing the distribution of earthquake magnitudes.
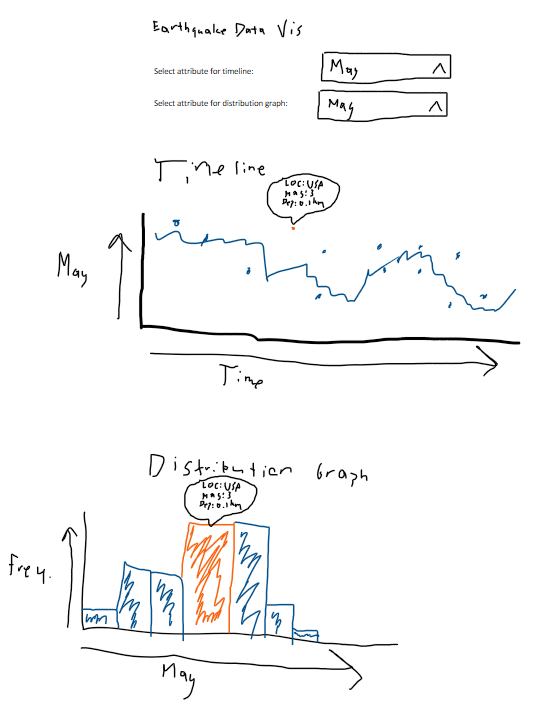
- Time Series Chart: A timeline displaying the number of earthquakes over time.
- Depth Chart: A histogram representing earthquake depth distribution.
Users can interact with filters to dynamically update the visualizations.
Design Sketches and Justifications
Initial design sketches outline the layout and interactions of the application:


The design prioritizes clarity and usability, ensuring users can easily filter and explore earthquake data.
Findings and Insights
- Earthquakes of magnitude 6.0+ are more frequent along tectonic plate boundaries.
- Deeper earthquakes tend to occur in subduction zones.
- Seasonal patterns in earthquake occurrences were observed.
Development Process
- Technology Stack: D3.js for data visualization, Leaflet.js for interactive maps, and HTML, CSS, JavaScript for front-end development.
- Code Repository: GitHub Repository
- Live Demo: View Application
- Demo Recording: View Demo Video